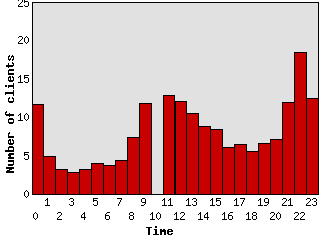
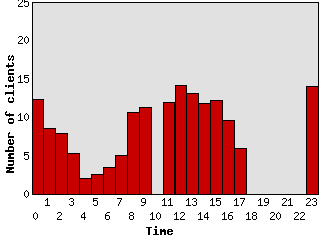
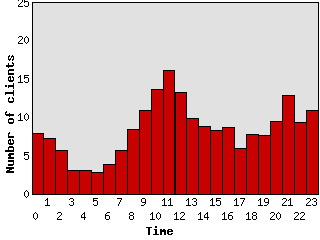
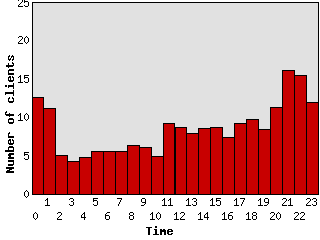
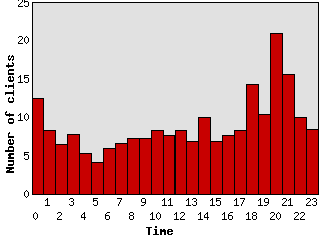
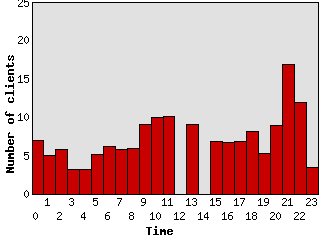
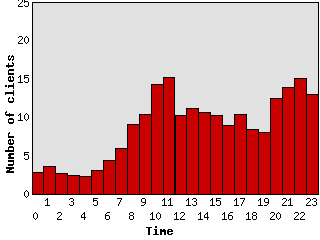
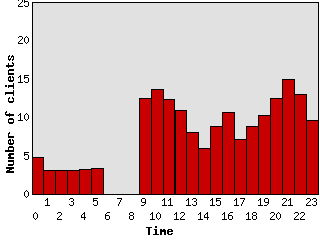
As threatened, Charles Cooke and I logged the number of users on #afp for a period in June 1999. This was intended to be 24 hours during the week and at the weekend, but we ended up with a log of about 9 days with a few breaks where the bot fell off the channel. I've now got round to crunching the raw data into averages and drawing some graphs.
The graphs below show the average number of users on channel during each hour, including the recording bot (cccb) and the other (cccb-se) if that was present. Missing bars show hours during which the recording bot was off-channel at some time. Times and dates are all in UTC (=GMT). The graphs were drawn using some Perl scripts of my own devising, using the Chart::Bar module written by David Bonner and Peter Clark.
This probably wasn't an ideal weekend to use, because nearly 20 regular users were meeting in Cambridge.
Thursday 17th
Friday 18th
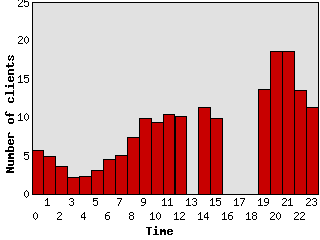
Saturday 19th
Sunday 20th
Monday 21st
Tuesday 22nd
Wednesday 23rd
Thursday 24th
Friday 25th